TM 1-1510-223-10
Change 3 7-7
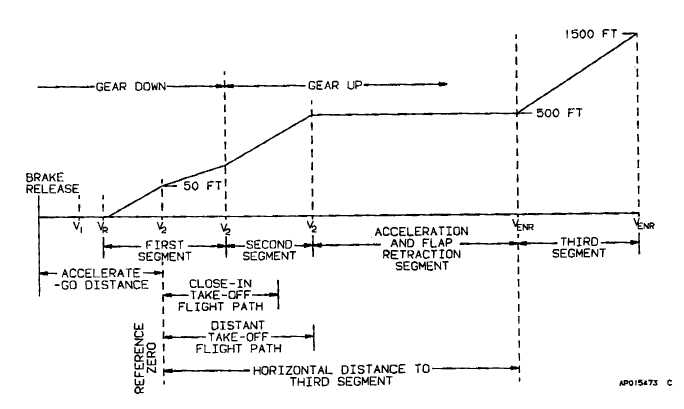
extends to 1500 feet above the runway. Air-
speed is maintained at VENR during this seg-
ment.
j.
Takeoff Path Profile (Flaps Approach). The follow-
ing examples illustrate the use of the flaps-approach
takeoff path graphs. Enter the graphs at 15 C FAT, 3499
feet pressure altitude, 16,000 pounds takeoff weight,
1.9% downhill runway gradient, and a 10-knot headwind
component.
(1) Example 1 - close-in obstacle clearance: giv-
en:
Obstacle height Above Aircraft at Brake Release...88
feet
Obstacle Distance from Brake Release...16,294 feet
1. The obstacle horizontal distance from refer-
ence zero equals the obstacle distance from
brake release less the accelerate-go distance
to 50 feet AGL (16,294 ft - 5357 ft) = 10,937
feet = 1.8 nautical miles.
2. Determine the total height required to clear the
obstacle by adding to the obstacle height the
decrease in aircraft altitude during the takeoff
procedure due to a downhill runway gradient.
1.9% gradient 5357 ft = 101.8 feet = 102 feet
The total height required to clear the obstacle is: 88 ft
+ 102 = 109 feet.
3. Obtain the required gradient to clear the ob-
stacle from the Distant Takeoff flight Path
Graph using the obstacle distance from refer-
ence zero found in step 1, and the total height
determined in step 2: 1.28%.
4. Read the scheduled net gradient of climb from
the NET TAKEOFF FLIGHT PATH - SECOND
SEGMENT - FLAPS APPROACH graph:
1.94%.
Thus, the calculations indicate that a takeoff weight of
16,000 pounds will result in a net climb gradient greater
than that required to clear the obstacle, even if an engine
should fail at the most critical takeoff point.
(2) Example 2 - Obstacle clearance above 500
feet: given:
Obstacle Height Above Aircraft at Brake Release .600
feet.
Figure 7-1. Takeoff Path Profile One Engine Inoperative